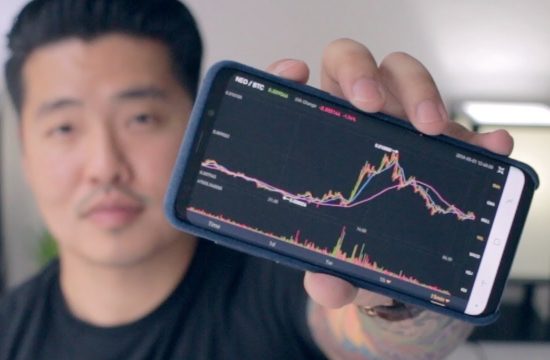
Cryptocurrency technical setups involve analyzing price charts and indicators to identify potential trading opportunities. Traders utilize various patterns, such as candlestick formations and trendlines, alongside technical indicators like moving averages and RSI to make informed decisions.
In practice, traders must recognize that technical setups are not foolproof; market sentiment and external factors can heavily influence price movements. Therefore, while a technical pattern may suggest a bullish or bearish trend, it’s essential to consider broader market conditions and fundamental analysis. This dual approach helps mitigate risks associated with false signals.
Moreover, one common mistake among novice traders is over-reliance on a single indicator without considering the overall market context. For example, a bullish candlestick pattern might appear on a chart, but if the broader market trend is bearish, acting solely on that setup could lead to losses. Therefore, integrating multiple indicators and understanding their interactions is vital for sound trading decisions.
Understanding Candlestick Patterns
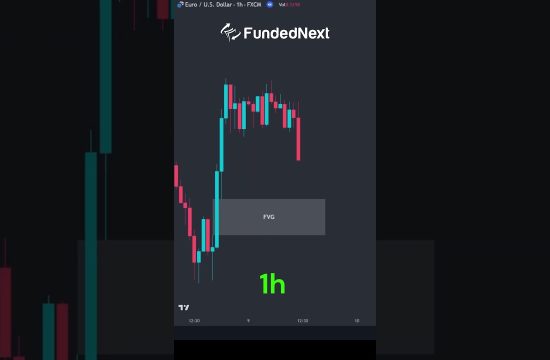
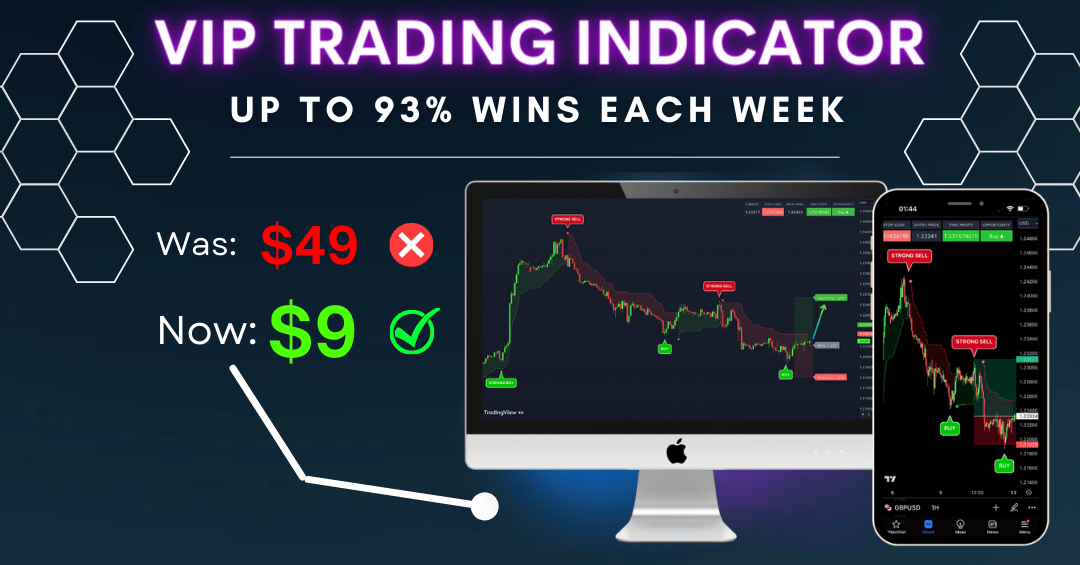
Candlestick patterns are vital components of cryptocurrency technical setups, providing visual insights into market sentiment over specific time frames. Each candlestick reflects open, close, high, and low prices within a defined period, revealing potential market reversals or continuations. Recognizing patterns like doji, hammers, and engulfing candles can help traders gauge market psychology.
However, relying solely on candlestick patterns can be misleading without context. For instance, a bullish engulfing candle appearing after a prolonged downtrend can signal a reversal, but if it occurs at a resistance level, the potential for a false breakout increases. Thus, traders should consider the overall trend and volume before acting on these signals.
Additionally, many traders overlook the significance of time frames when analyzing candlestick patterns. Patterns that appear on shorter time frames may not hold the same weight as those on daily or weekly charts. Therefore, aligning candlestick analysis with higher time frames can provide a clearer picture of market direction and improve decision-making.
Utilizing Technical Indicators Effectively
Technical indicators are essential tools in cryptocurrency trading, serving to confirm signals derived from price action and patterns. Popular indicators include the Relative Strength Index (RSI), Moving Averages (MA), and Bollinger Bands. Each of these indicators provides unique insights into market conditions, helping traders identify overbought or oversold situations.
While indicators can enhance trading strategies, they should not be used in isolation. For example, using an RSI reading to determine overbought conditions can be helpful, but if the price is in a strong uptrend, it may remain overbought for an extended period. Therefore, traders should combine indicators with price action analysis for more reliable signals.
Moreover, it’s crucial to avoid the pitfall of indicator overload, where traders incorporate too many indicators into their analysis. This can lead to confusion and conflicting signals. Instead, focus on a few key indicators that complement your trading style and strategy, ensuring clarity in decision-making.
Common Mistakes in Technical Analysis
Many traders fall victim to common mistakes in technical analysis, which can hinder their trading success. One prevalent error is failing to adapt to changing market conditions. The cryptocurrency market is known for its volatility, and what worked in one market phase may not be effective in another. Traders should remain flexible and adjust their strategies as needed.
Another mistake involves ignoring stop-loss orders. Many novice traders enter positions without a clear exit strategy, risking significant losses. Setting stop-loss orders based on technical levels can help protect against adverse price movements, allowing traders to manage risk effectively.
Furthermore, emotional trading can lead to poor decision-making. Fear and greed are powerful emotions that can cloud judgment. Developing a disciplined trading plan that includes entry and exit strategies, along with risk management techniques, is essential for maintaining objectivity in trading.
Integrating Fundamental Analysis
While technical analysis is crucial for identifying trading setups, integrating fundamental analysis can enhance a trader’s perspective. Understanding the underlying factors driving cryptocurrency prices, such as news events, regulatory changes, and market sentiment, can provide valuable context for technical setups.
For instance, a strong technical setup may signal a buying opportunity, but if negative news about a cryptocurrency emerges, it can quickly reverse the trend. Therefore, traders should remain informed about current events and market developments that may impact their trades.
Additionally, considering market sentiment through social media and community discussions can offer insights into potential price movements. Monitoring sentiment can help traders identify potential reversals or continuations that technical indicators might not reveal.
Creating a Trading Plan
A comprehensive trading plan is essential for success in cryptocurrency trading. This plan should outline your trading goals, risk tolerance, and strategies for entering and exiting trades. Incorporating both technical and fundamental analysis into your plan can enhance your decision-making process.
Moreover, establishing clear criteria for entering and exiting trades based on technical setups can help maintain discipline. For example, you might set specific conditions for entering a trade based on a particular candlestick pattern combined with a confirmation from an indicator.
Lastly, regularly reviewing and adjusting your trading plan is crucial as market conditions change. This iterative process ensures that your strategies remain relevant and effective in the dynamic cryptocurrency landscape.
Further Reading
Authoritative Sources
- Investopedia
investopedia.comA comprehensive resource for understanding trading concepts, including technical setups and indicators
- CoinDesk
coindesk.comOffers news and analysis on cryptocurrency markets, helping traders stay informed about market trends
- Binance Support
binance.comProvides educational resources and guides on trading strategies and technical analysis
Frequently Asked Questions
What are the best technical indicators for cryptocurrency trading?
Commonly used indicators include Moving Averages, RSI, and MACD, which help traders identify trends and potential reversal points.
How can I identify a strong candlestick pattern?
Look for clear formations, such as engulfing or hammer patterns, and consider their context within the overall trend and volume.
What mistakes should I avoid in technical analysis?
Avoid over-reliance on a single indicator, ignoring market context, and emotional trading, which can lead to poor decision-making.
How does fundamental analysis impact technical setups?
Fundamental analysis provides context for price movements, helping traders understand external factors that may affect their technical setups.
What is the importance of a trading plan?
A trading plan outlines goals, strategies, and risk management, helping traders maintain discipline and make informed decisions.
Conclusion
In conclusion, mastering cryptocurrency technical setups requires a blend of technical analysis, market awareness, and disciplined trading practices. By understanding candlestick patterns, utilizing indicators effectively, and integrating fundamental analysis, traders can make more informed decisions. Avoiding common mistakes and creating a comprehensive trading plan will further enhance your chances of success in the dynamic cryptocurrency landscape. Stay adaptable and continuously educate yourself to navigate this ever-evolving market confidently.