Bitcoin candlestick trading involves analyzing price movements using candlestick charts, which depict open, high, low, and close prices over specific time intervals. This method allows traders to identify market trends and potential reversals through various candlestick patterns, enhancing their trading decisions.
Understanding the nuances of candlestick patterns is crucial for any trader looking to navigate the volatile bitcoin market. Each candlestick provides insight into market behavior, with patterns indicating bullish or bearish trends. Common mistakes include misreading these patterns or failing to consider the broader market context, which can lead to poor trading decisions.
Many new traders overlook the importance of volume in conjunction with candlestick patterns. Volume can validate a pattern; for instance, a bullish engulfing pattern accompanied by high volume is more significant than the same pattern with low volume. Prioritizing volume analysis alongside candlestick patterns can lead to more successful trading outcomes.
Understanding Candlestick Patterns
Candlestick patterns are visual representations of price movements in a specific time frame. Each candlestick reflects the open, high, low, and close prices, providing a snapshot of market sentiment. Traders analyze these patterns to identify potential market reversals or continuations. Recognizing key patterns can significantly enhance trading strategies, allowing for better timing in entering and exiting positions.
For example, a series of bullish candles may indicate a strong uptrend, while a series of bearish candles could signal a downtrend. Understanding these patterns helps traders assess market momentum and make informed decisions. A common pitfall is interpreting a single candlestick without considering the broader context, such as preceding price action and market news.
Traders should also be aware that no pattern is foolproof. Market conditions can change rapidly, and external factors can influence price movements. Thus, combining candlestick analysis with other technical indicators can provide a more comprehensive view of market dynamics.
Key Candlestick Patterns in Bitcoin Trading
Several key candlestick patterns are particularly relevant in bitcoin trading. Among the most notable are the bullish engulfing pattern, the bearish engulfing pattern, and the hammer. Each of these patterns carries specific implications for future price movement.
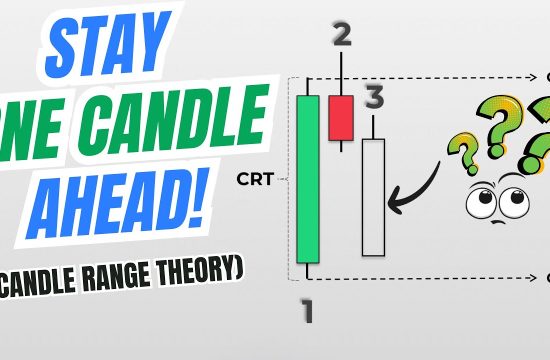
The bullish engulfing pattern occurs when a smaller bearish candle is followed by a larger bullish candle, suggesting a potential reversal from a downtrend. Conversely, the bearish engulfing pattern indicates a shift from bullish to bearish sentiment. The hammer pattern, characterized by a small body and long lower wick, suggests potential reversals at market bottoms. Recognizing these patterns can aid traders in making timely decisions.
It’s essential for traders to confirm these patterns with other indicators such as moving averages or RSI (Relative Strength Index). Relying solely on candlestick patterns without additional confirmation can lead to false signals and potential losses. Therefore, integrating multiple forms of analysis is crucial for effective trading.
Integrating Volume Analysis
Volume analysis is a critical component of successful candlestick trading. It provides insight into the strength of a price movement, validating the significance of candlestick patterns. High volume during a bullish candlestick pattern indicates strong buying interest, while low volume may suggest a lack of conviction in the price movement.
For instance, if a bullish engulfing pattern appears on a candlestick chart but is accompanied by low volume, traders should be cautious. This could indicate that the price movement lacks support, making it vulnerable to reversal. Conversely, a bullish engulfing pattern with high volume can signal a robust trend, encouraging traders to enter long positions.
Traders should consistently monitor volume alongside candlestick patterns to enhance their trading strategies. This dual analysis can help filter out false signals and improve overall trading accuracy. Prioritizing volume can provide a clearer picture of market dynamics, leading to more informed decision-making.
Common Mistakes in Candlestick Trading
Despite the effectiveness of candlestick patterns, traders often fall into common traps that undermine their strategies. One major mistake is relying solely on candlestick patterns without considering other market factors. For example, failing to analyze broader market trends or economic indicators can lead to misinterpretations of candlestick signals.
Another frequent error is neglecting to set stop-loss orders. Traders may become overly confident in their analysis, leading them to overlook the importance of risk management. Setting stop-loss orders can protect capital and limit losses in volatile markets like bitcoin.
Additionally, emotional trading can significantly impact decision-making. Traders may react impulsively to market movements, leading to hasty decisions that deviate from their trading plans. Maintaining discipline and adhering to a well-defined trading strategy is crucial for long-term success in bitcoin candlestick trading.
Further Reading
Authoritative Sources
- Introduction to Candlestick Charting
investopedia.comInvestopediaThis resource provides a comprehensive overview of candlestick charting techniques and their applications in trading
- Candlestick Patterns
babypips.comBabyPipsA detailed guide to various candlestick patterns and their significance in forex and cryptocurrency trading
- TradingView
tradingview.comTradingViewA popular platform for charting and analyzing candlestick patterns with real-time data
Frequently Asked Questions
What is a candlestick chart?
A candlestick chart is a type of financial chart used to represent price movements over time, displaying the open, high, low, and close prices for a specific period.
How do I read candlestick patterns?
To read candlestick patterns, observe the body and wicks of the candles, noting their size and position relative to previous candles to identify potential market trends or reversals.
What are the most common candlestick patterns?
Common candlestick patterns include the bullish engulfing, bearish engulfing, hammer, and shooting star, each indicating different market sentiments.
How can I improve my candlestick trading?
Improving candlestick trading involves integrating volume analysis, setting stop-loss orders, and maintaining discipline in your trading strategy.
What mistakes should I avoid in candlestick trading?
Avoid common mistakes such as misreading patterns, neglecting volume analysis, and emotional trading, which can lead to poor decision-making.
Conclusion
In conclusion, bitcoin candlestick trading is a valuable technique for analyzing price movements and making informed trading decisions. Understanding key candlestick patterns and integrating volume analysis can significantly enhance trading outcomes. Traders should prioritize risk management and avoid common pitfalls to navigate the volatile bitcoin market effectively. By developing a disciplined trading strategy and continuously learning, traders can improve their chances of success in this dynamic environment.
Related Content
- Master the Market: Essential Insights to Learn Bitcoin Trading Effectively
- Bitcoin Price Watch: Momentum Stalls as $123K Resistance Looms
- Crypto Scalping Strategies: Proven Techniques for Rapid Profits
- Bitcoin Trading Strategies: Effective Methods for Maximizing Your Gains
- CRYPTO ALERT: WE ARE ABOUT TO FLIP!!